MADD: a fairness metric for predictive student models
fairness
learning analytics
pattern: live + frozen
Pattern (a) — live computation from an external repo, frozen for fast, reproducible site builds.
Published
1 June 2024
Modified
20 June 2026
ImportantIntegration pattern (a): live & frozen
This page runs code from an external project. The project lives in its own repository, pulled in here as a Git submodule under _external/, and is executed using that project’s own environment — never the website’s. After rendering once locally, the results are stored in _freeze/ and committed, so rebuilding the whole site (locally or in CI) needs neither the submodule’s code nor its dependencies.
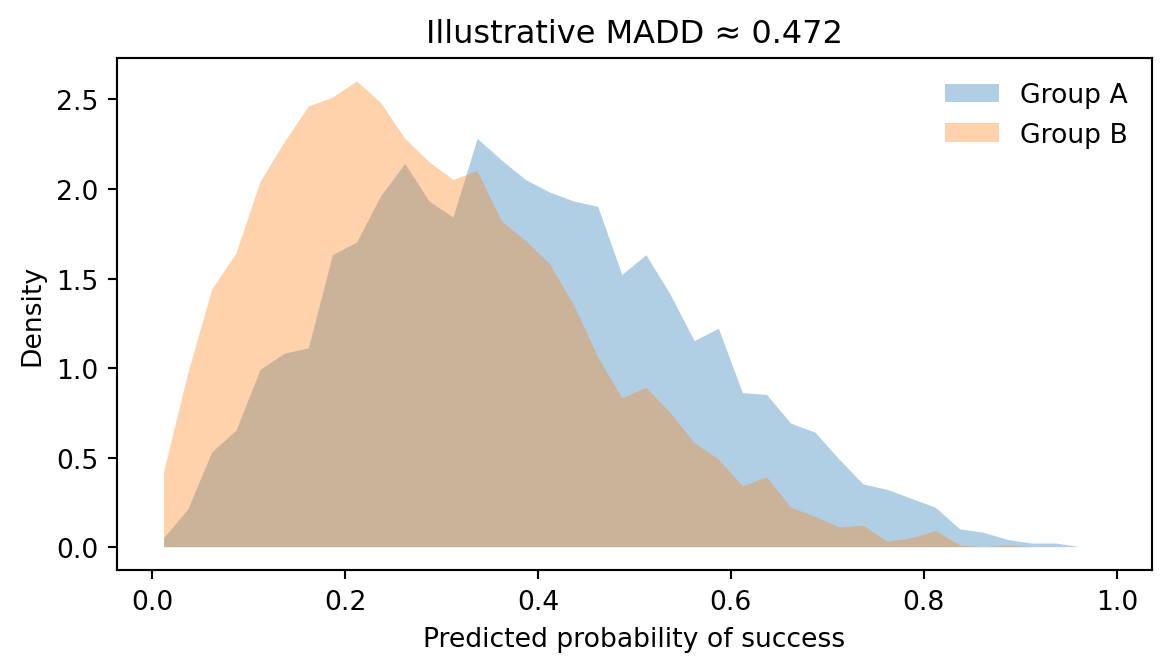
MADD (Model Absolute Density Distance) is a metric to evaluate the algorithmic fairness of predictive student models independently of their predictive performance, introduced with Mélina Verger, Sébastien Lallé and Vanda Luengo. This page reproduces a small illustrative figure directly from the project code.
Reproducible figure
# -------------------------------------------------------------------------# REAL USAGE (uncomment once the submodule is in place):## from madd import madd, plot_group_densities # from _external/madd# import pandas as pd# df = pd.read_csv("../_external/madd/data/mooc_sample.csv")# score = madd(df, group_col="gender", proba_col="p")# plot_group_densities(df, group_col="gender", proba_col="p")## Below is a SELF-CONTAINED stand-in so the skeleton renders out of the box.# Replace it with the import above. It uses only numpy/matplotlib, which belong# to the *project* environment, not the website environment.# -------------------------------------------------------------------------import numpy as npimport matplotlib.pyplot as pltrng = np.random.default_rng(0)group_a = rng.beta(2.5, 4.0, 4000) # predicted P(success) for group Agroup_b = rng.beta(2.0, 5.0, 4000) # predicted P(success) for group Bgrid = np.linspace(0, 1, 200)def density(x):from numpy import histogram h, edges = histogram(x, bins=40, range=(0, 1), density=True) centers = (edges[:-1] + edges[1:]) /2return centers, hca, da = density(group_a)cb, db = density(group_b)madd_score = np.trapz(np.abs(np.interp(grid, ca, da) - np.interp(grid, cb, db)), grid)fig, ax = plt.subplots(figsize=(6.2, 3.6))ax.fill_between(ca, da, alpha=.35, label="Group A")ax.fill_between(cb, db, alpha=.35, label="Group B")ax.set_xlabel("Predicted probability of success")ax.set_ylabel("Density")ax.set_title(f"Illustrative MADD ≈ {madd_score:.3f}")ax.legend(frameon=False)fig.tight_layout()plt.show()
/tmp/ipykernel_476848/1057510357.py:30: DeprecationWarning: `trapz` is deprecated. Use `trapezoid` instead, or one of the numerical integration functions in `scipy.integrate`.
  madd_score = np.trapz(np.abs(np.interp(grid, ca, da) - np.interp(grid, cb, db)), grid)
Figure 1: Predicted-probability densities for two groups; MADD measures the area between them.
Links
Source repository: https://github.com/USER/madd(replace with the real URL)